

Transform Field Data into Actionable Intelligence
Collect, integrate, analyze, and visualize data from any source through a single cloud platform designed for public health, environmental monitoring, research, and operational decision making.
Vector Analytica is a comprehensive data analysis platform designed to help organizations unlock insights from complex datasets. Our four core functions—Collection, Integration, Analysis, and Visualization—work seamlessly together to transform raw data into actionable intelligence.
We help clients—scientists, nonprofits, organizations, and governments—discover and decipher important patterns inside the mountains of data they collect.
Our most recent applications have been focused on public health and epidemiology, especially in the critical area of vector-borne diseases.
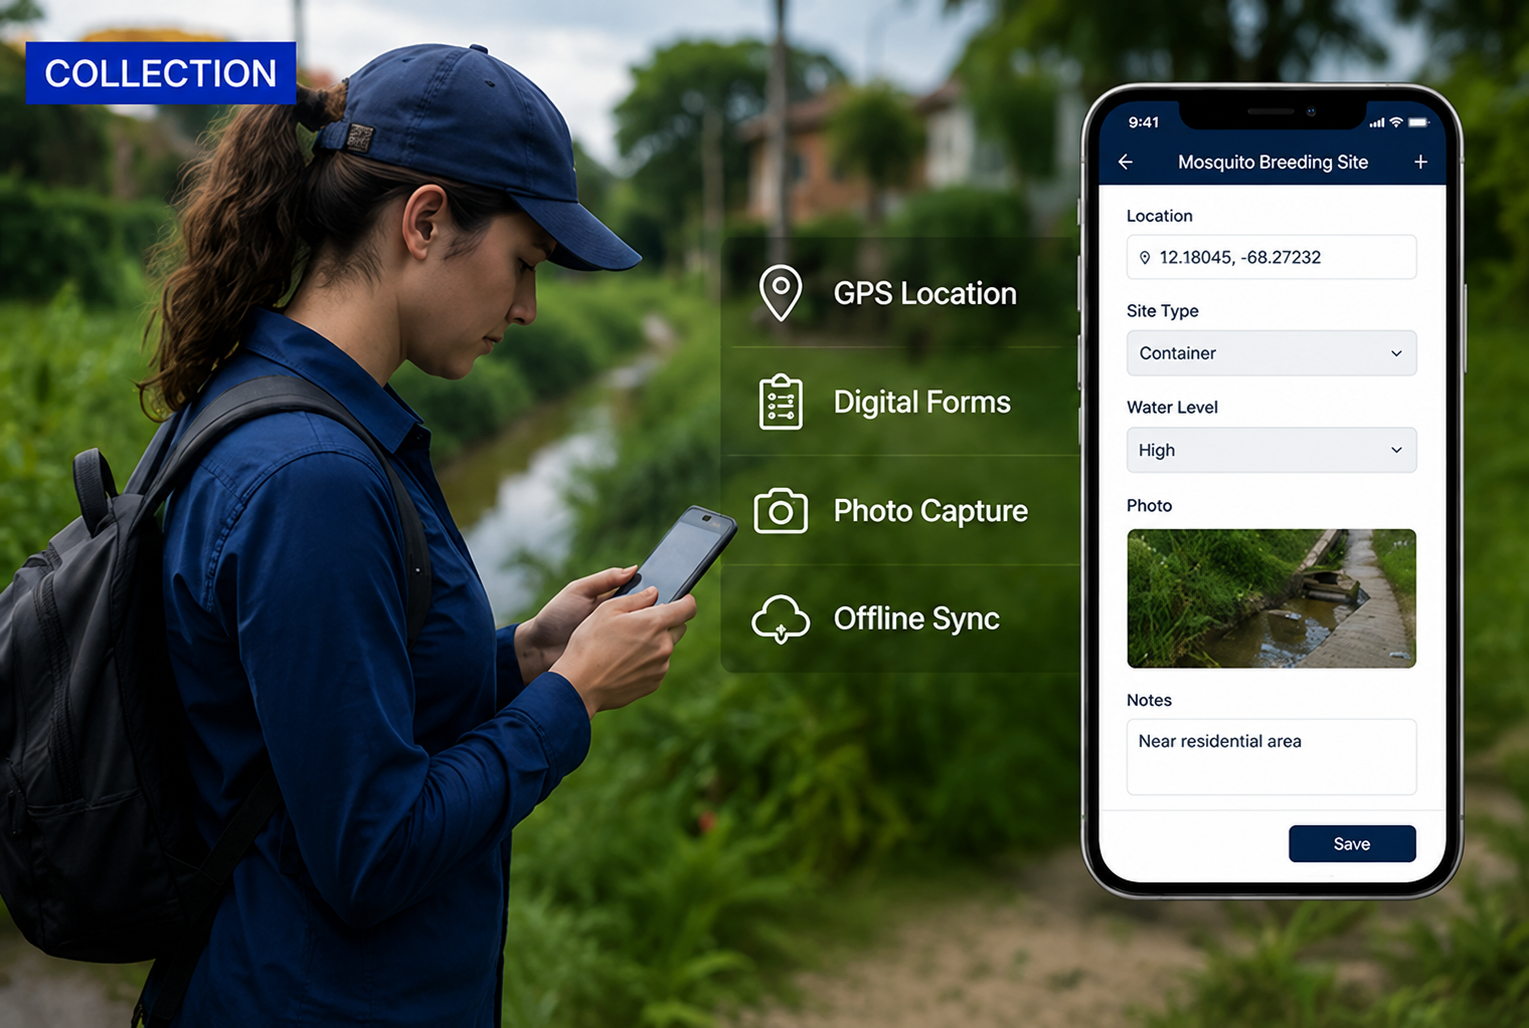
Collection
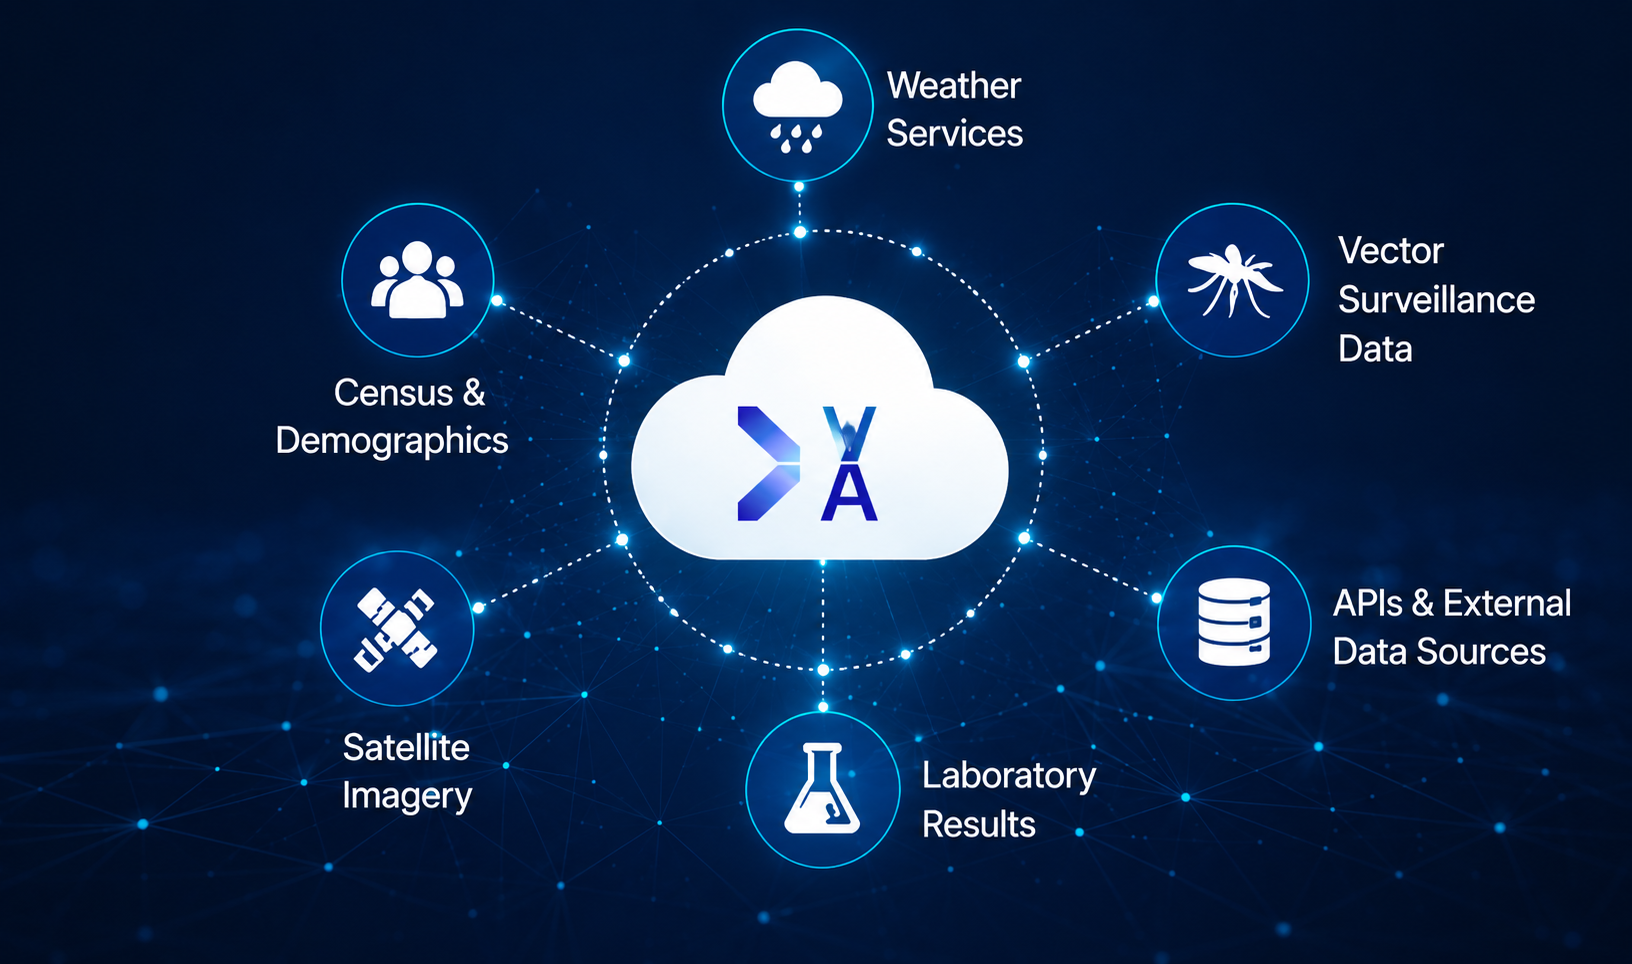
Integration
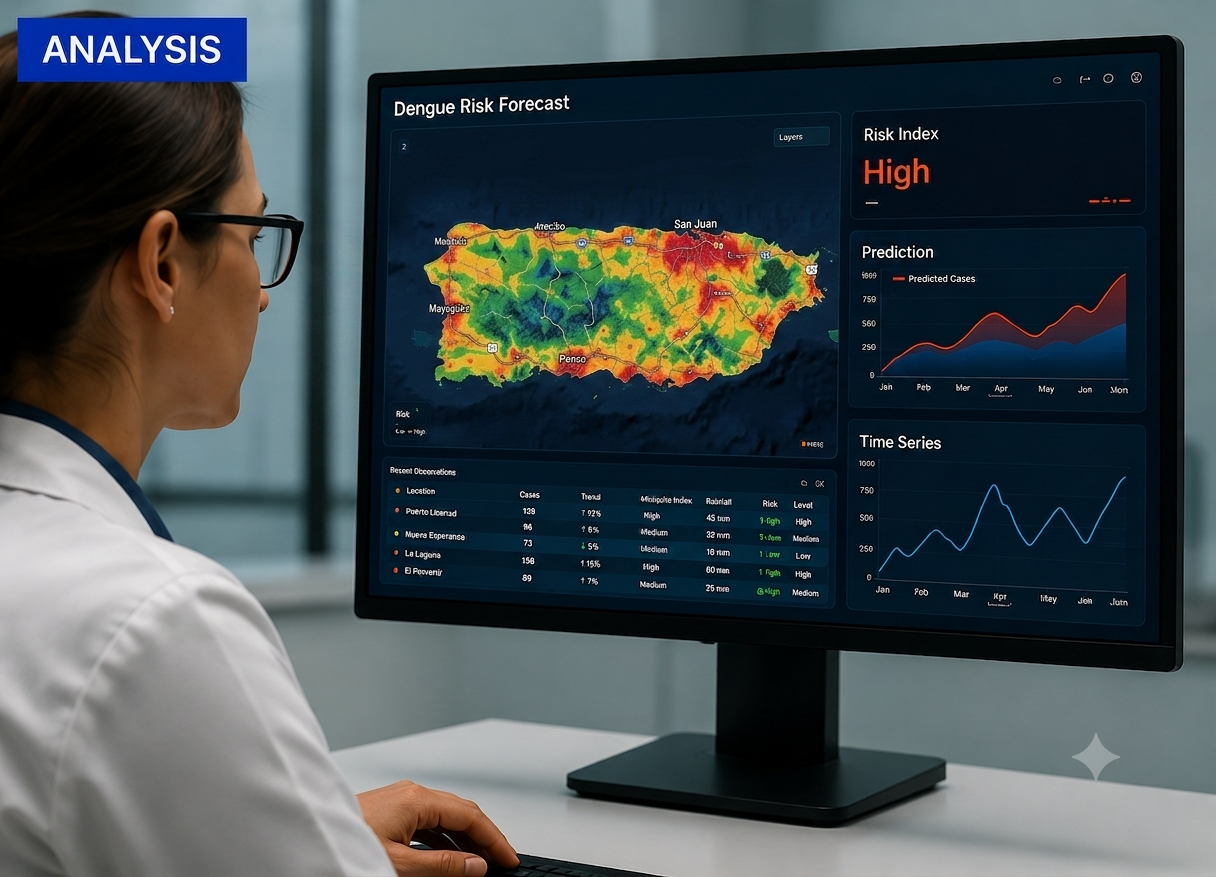
Analysis & Visualization
You don't need a degree in data science or GIS to unlock state-of-the-art intelligence. Our intuitive, DIY platform transforms complex, multi-source data into instant, actionable clarity—saving your team hours of work and sleepless nights.
We bring your data to life exactly when you need it through powerful statistical and spatial tools, including:
- Trend Analysis: Time-series and bar plots.
- Advanced Mapping: Interactive point, choropleth, heat, and bubble maps.
- See what you need to know, precisely when you need to know it
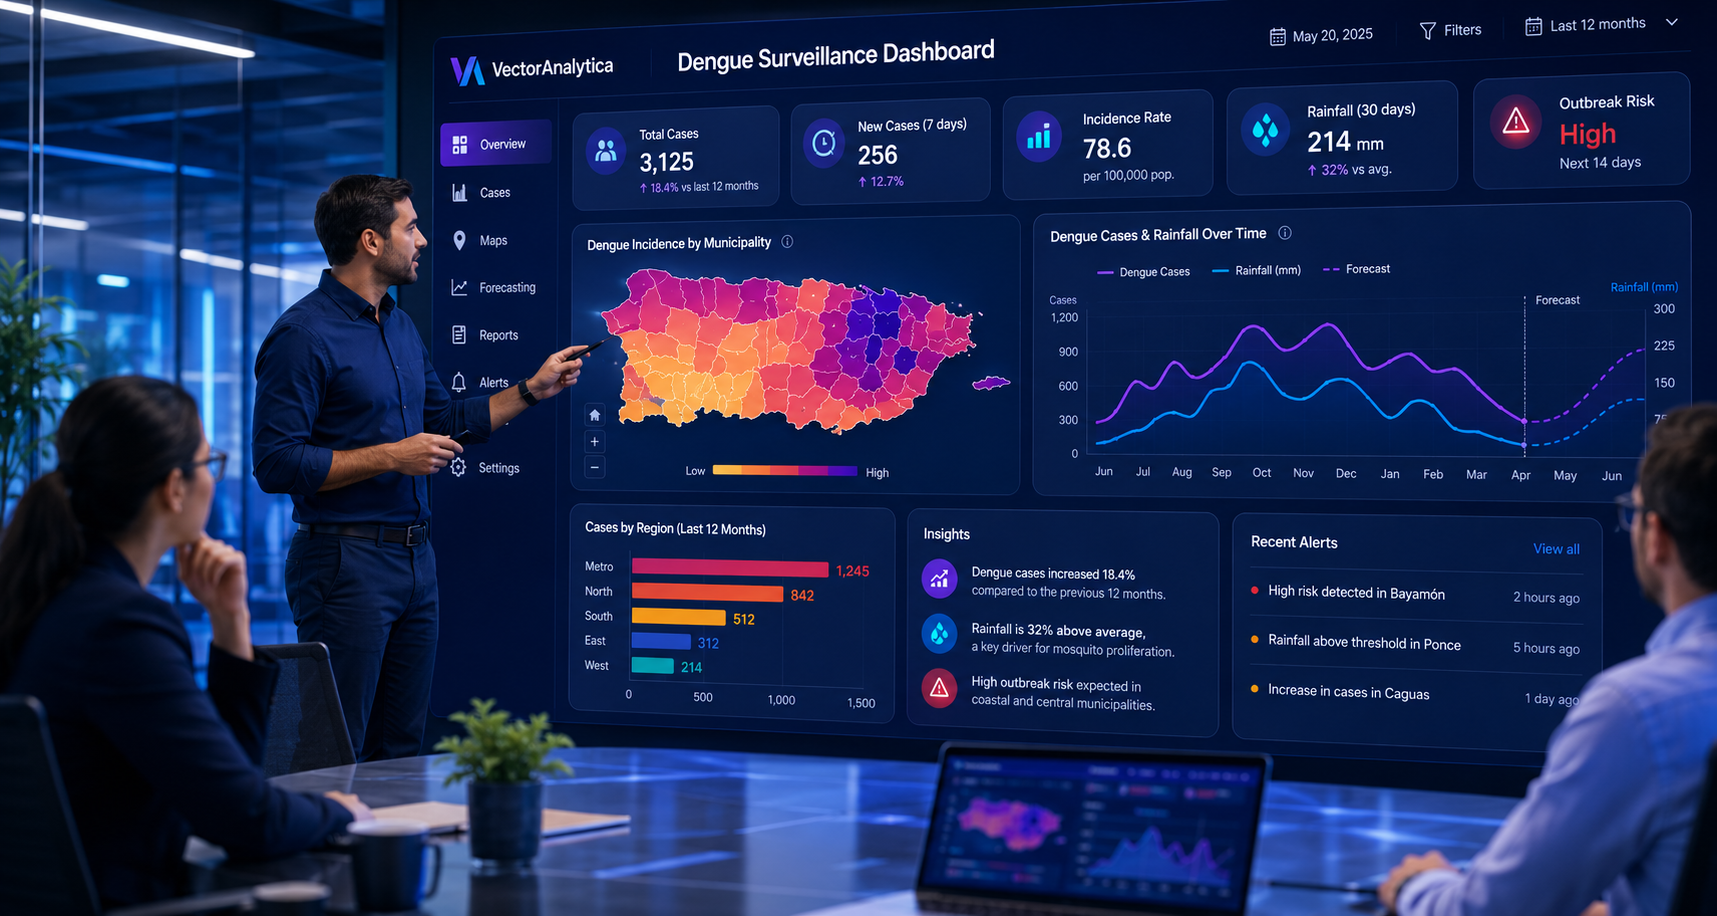
Smart Reporting & Custom Analytics
VectorAnalytica transforms complex environmental, spatial, and operational data into clear, forward-looking reports. Our interactive dashboards consolidate geographic hotspots, real-time trends, and predictive forecasts into a single view built for rapid decision-making.
Whether you need automated summaries or deep-dive data science, the platform scales to your exact workflow:
- Instant Dashboards: Track what is happening now and predict what is coming next with built-in, intuitive visual reports.
- Developer Flexibility: Seamlessly generate fully customized reports using R or Python for advanced statistical modeling and bespoke visualizations.
- Go beyond standard metrics—build tailored insights that fit your exact analytical workflow.
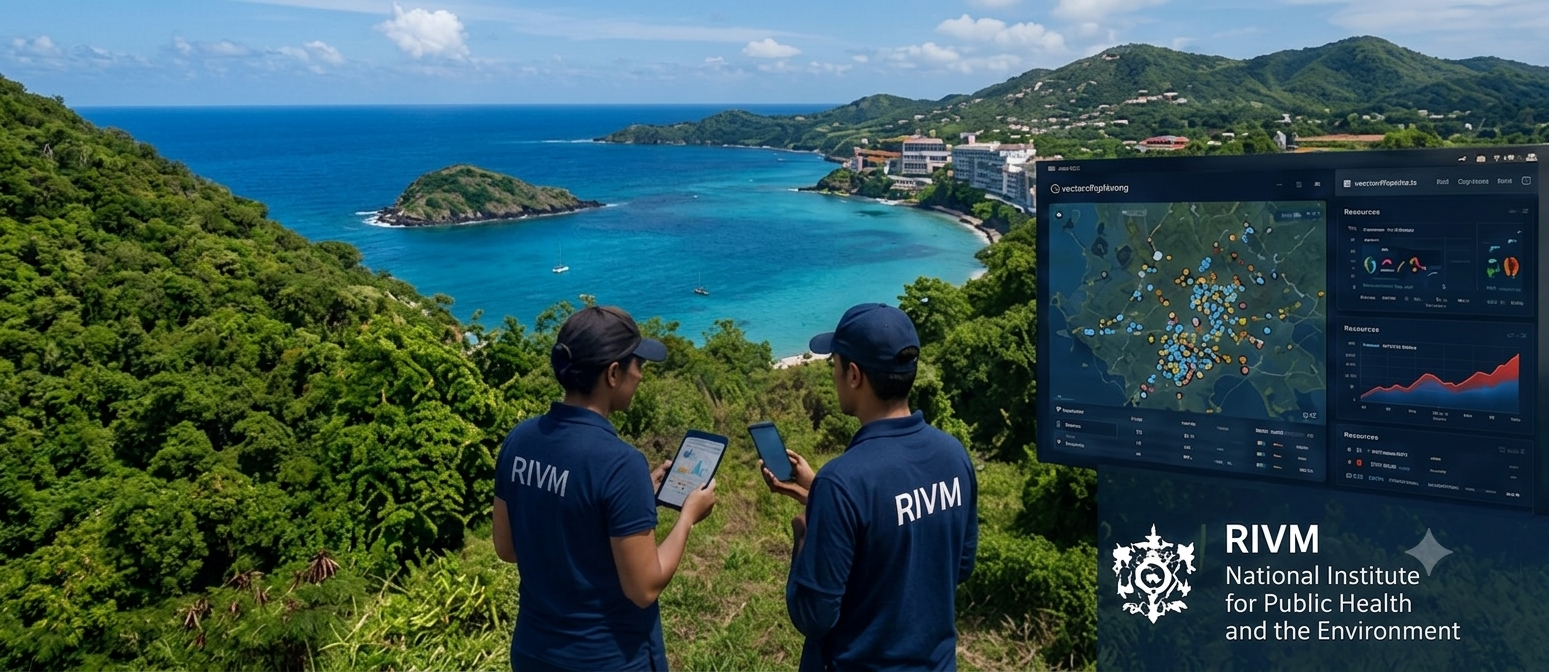
Case Study: National Institute for Public Health and the Environment (RIVM). The Netherlands.
The CaribbeanEcoHub platform developed by VectorAnalytica facilitates effective mosquito and rat surveillance in the islands of the Dutch Caribbean, thereby significantly enhancing their public health management system.
More Case StudiesLet's Connect
We'd love to hear from you. Schedule a zero-pressure phone call with our team to answer your questions and explore whether we have the right fit for your needs.